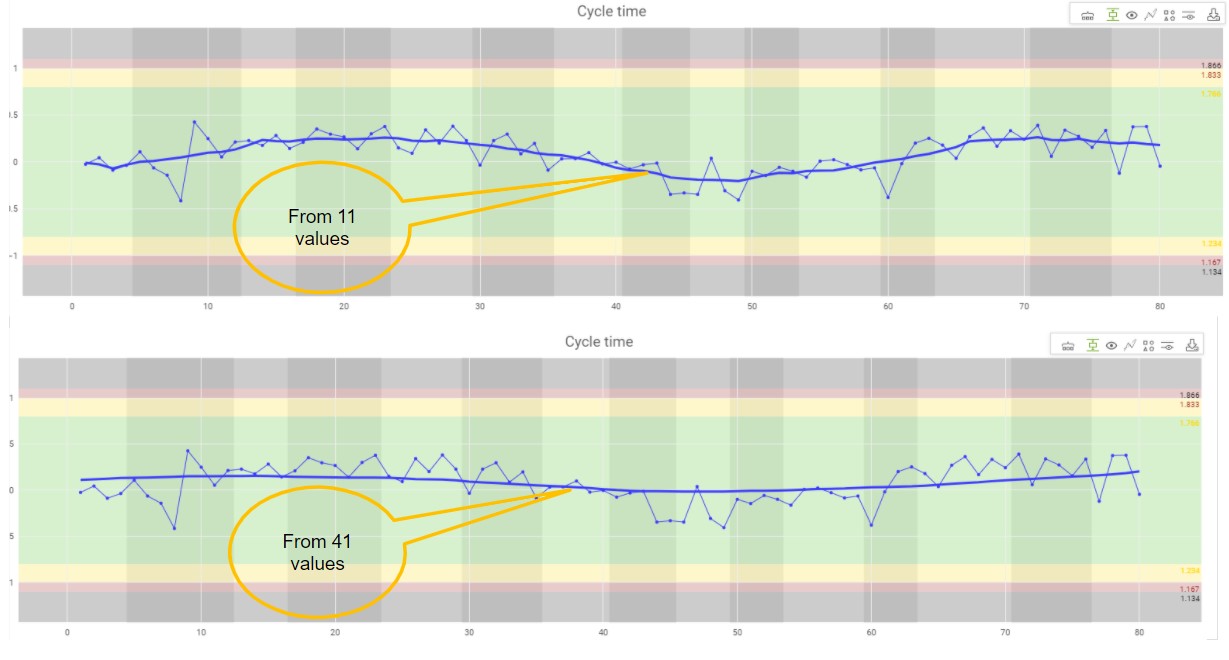
Smoothing in the Value chart
The new function - Smoothing is possible to turn on with the button in the value chart.
You can use smoothing to see which trend is in your process and to predict the behaviour of your processes.
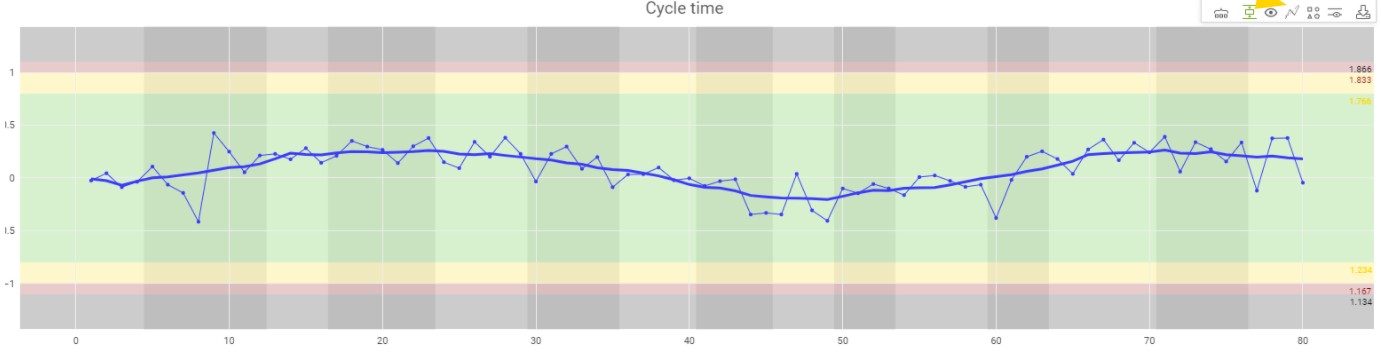
How to set it?
- Turn on the displayed trace
- Choose window type
- Time - the time period from which will be smoothing calculated
- Number of values - values from which will be smoothing calculated
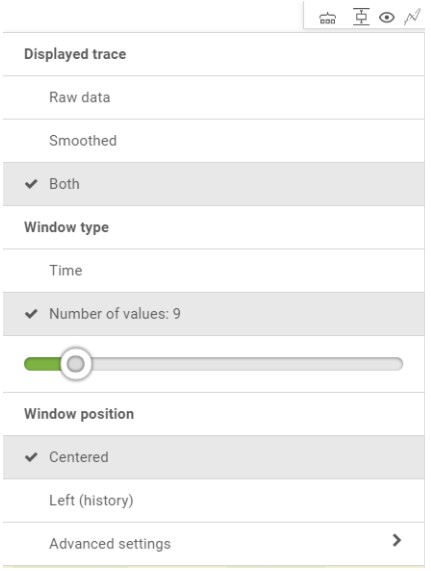
- Choose window position
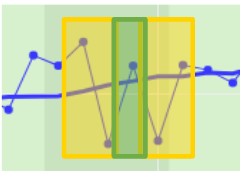
- Centred - The data from which the average value of the point on the smoothed function is calculated are centred. The average is calculated from an equal amount of values from the right and the left side of the graph.
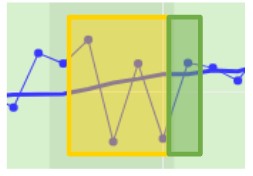
- Left (history) - The data from which the average value of the point on the smoothed function is calculated are from the left side of the graph.
*Beware of using a number of values or time period you use for the smoothing value. The bigger time it will be or the more values you will choose the bigger will be smoothing.